A field guide to probability distributions
The Standard Model census I built last time gave me the itch to do the same treatment for something I actually use, so here is a field guide to probability distributions.
It collects 24 named distributions, lets you bend their parameters and watch the curve respond, and shows how they all descend from a handful of mechanisms. You can open it here: A field guide to probability distributions.
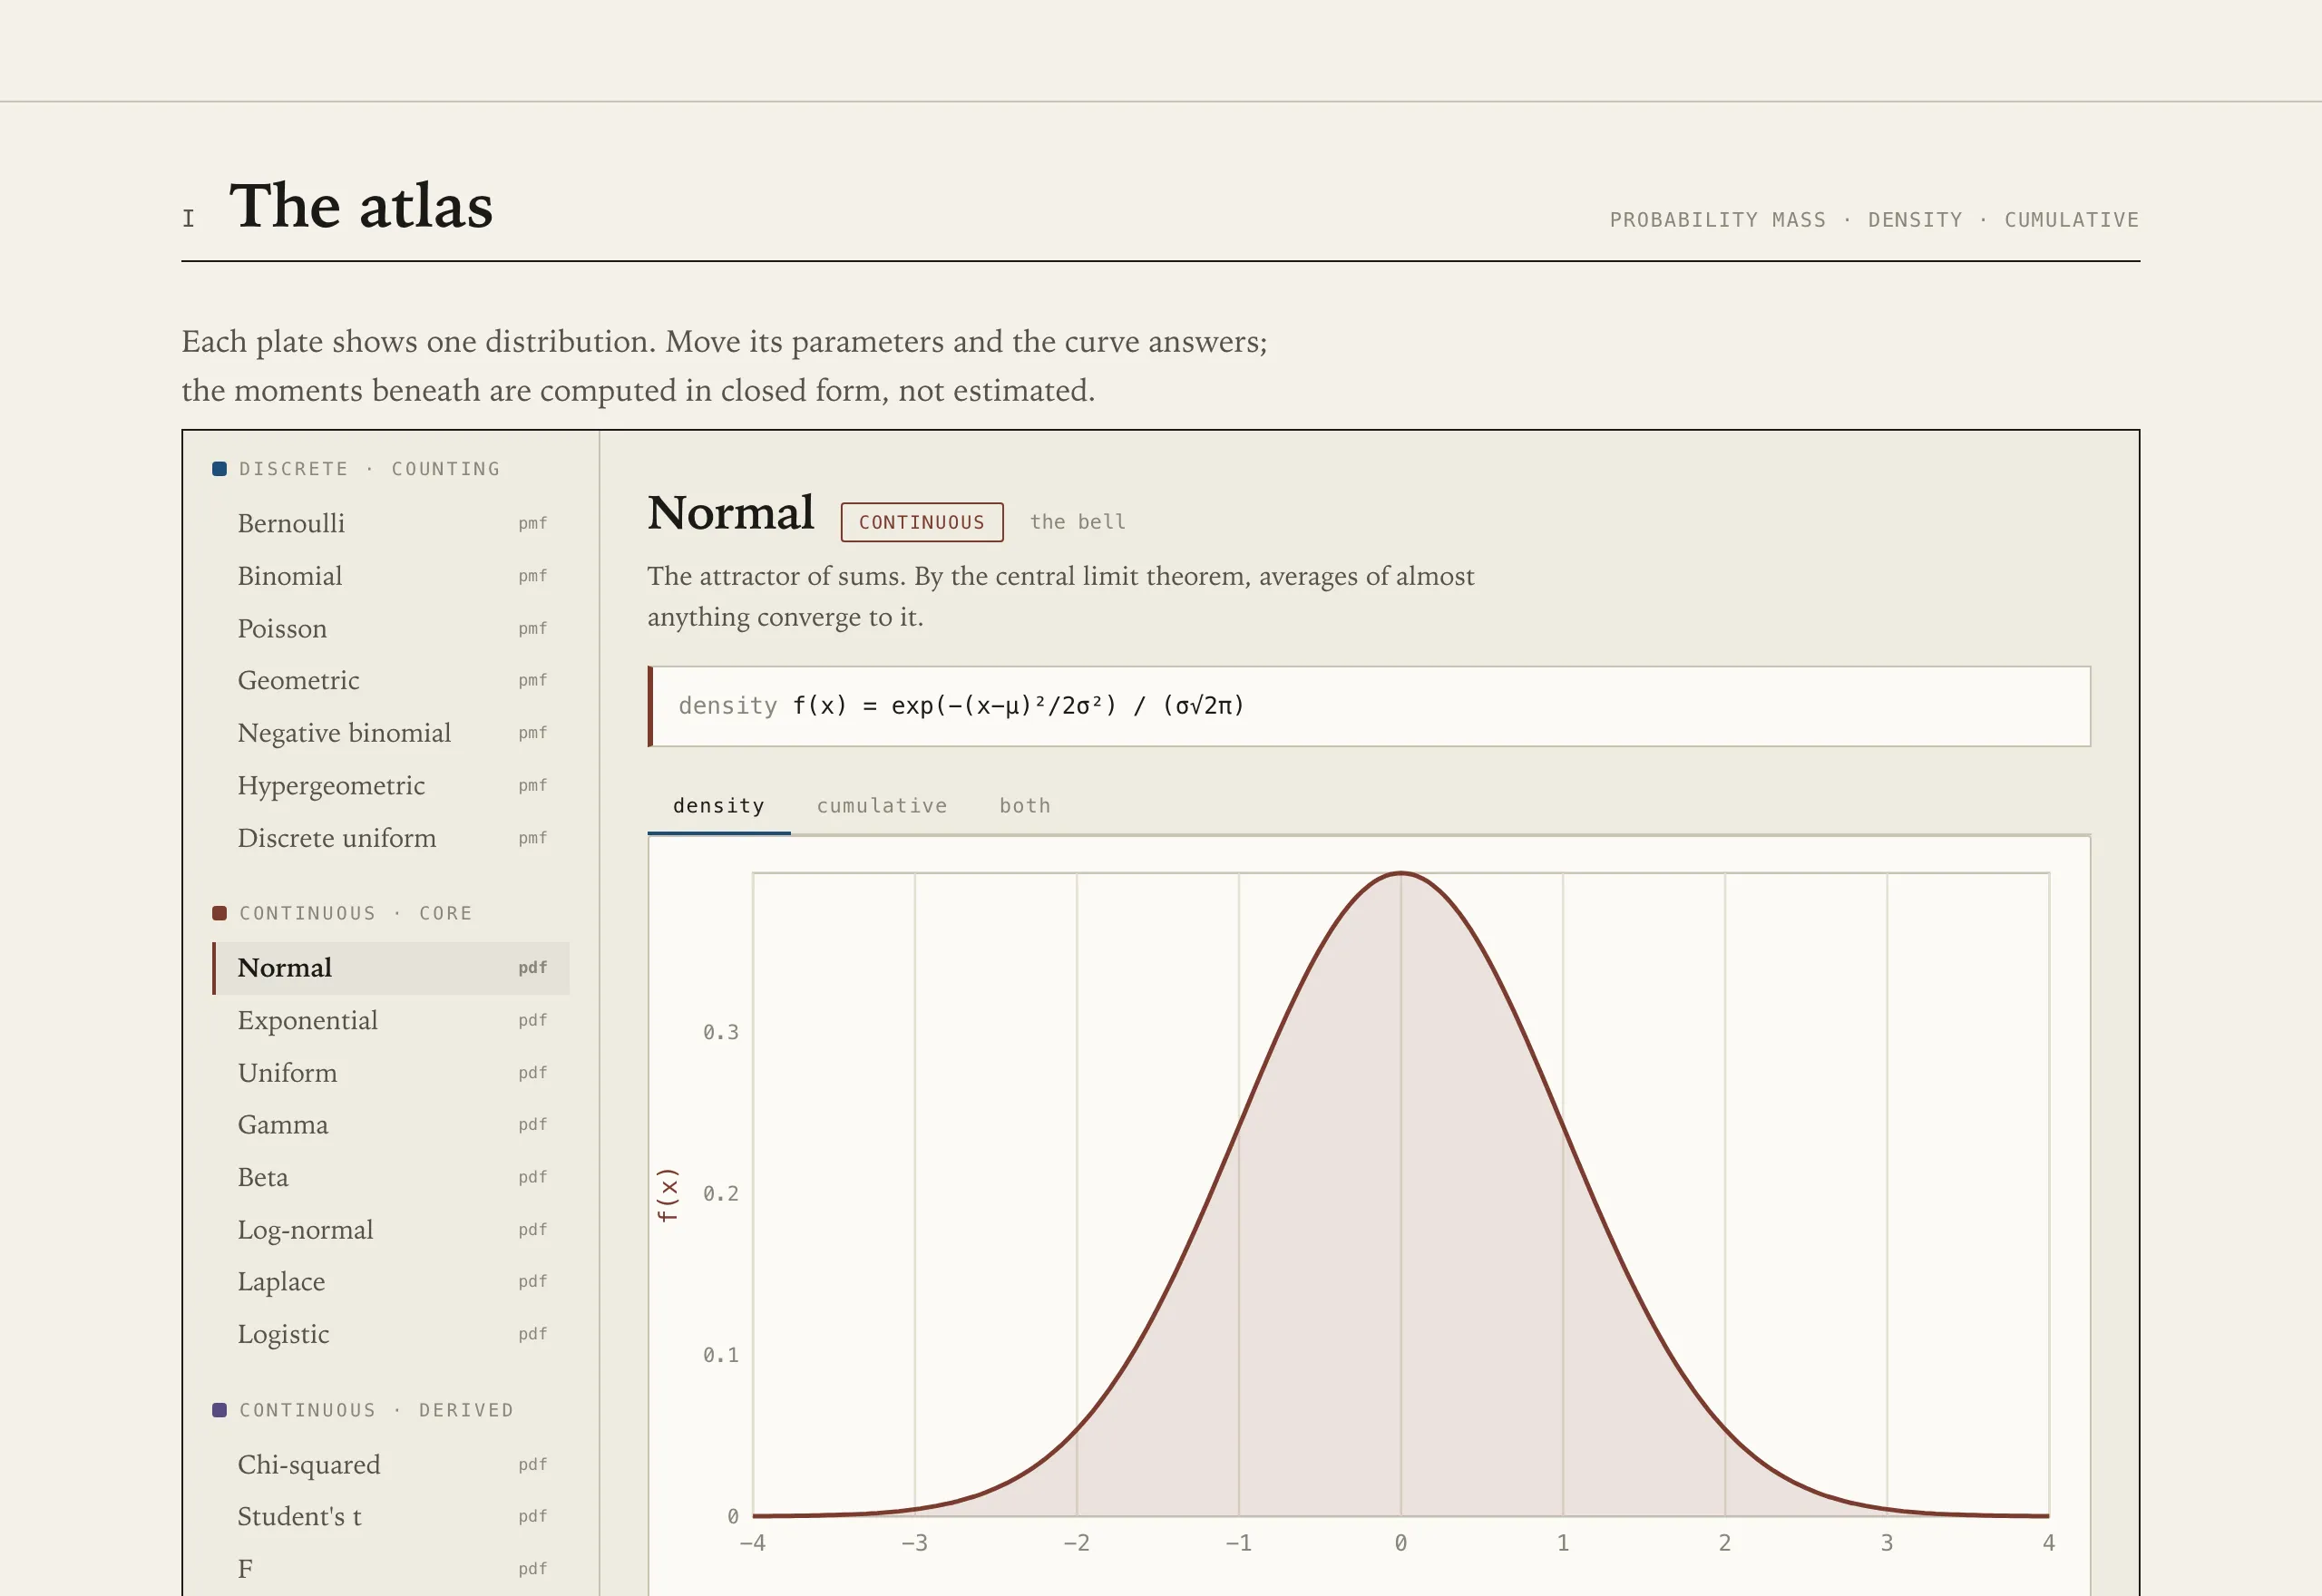
It has three parts. The atlas gives every distribution its own plate with the probability mass or density, the cumulative function, and the moments (mean, variance, skew, kurtosis) computed in closed form rather than estimated from samples. The lines of descent is a map of how the distributions connect, because most of them are not separate inventions. One turns into another as a limit, a sum, a transform, or a conjugate prior, and you can follow any edge to read the relation. Drawing by hand is a sampling lab: pick a source, draw from it, and the histogram fills toward its curve. Turn on averaging and the central limit theorem pulls the result toward a normal, no matter where you started.
The maths runs in the page. Cumulative functions use the regularized incomplete gamma and beta functions with continued fractions, plus the error function, and sampling uses inverse-transform and the usual generators. No libraries, no network calls, and it runs offline once you save the file.
Enjoy!
// comments